Canvas Graphics Lab
Part 1 - Drawing your first graphic
1. We’re starting off where we left off last module. The code that should have been provided should look familiar, though the code specific to our “Guess my number” game has been removed.
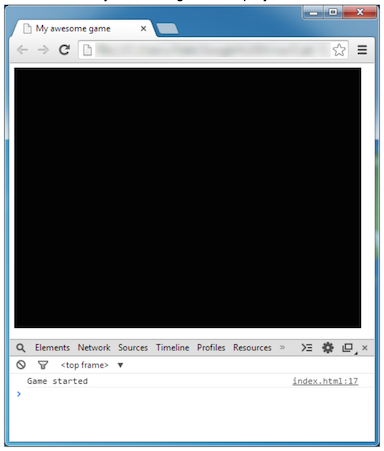
Make sure that your starting code displays a blank canvas and prints to the console.
|
2. Last time we added the canvas HTML tag and resized it with Javascript. This week we’ll start drawing some pictures to it so we won’t be limited to strictly text-based games.
Start by adding the following line below the line where we create a variable the points to the canvas tag:
| varcontext=theCanvas.getContext("2d"); |
varcontext=theCanvas.getContext("2d"); |
This creates a variable called “context” and assigns it to the 2D drawing context of the canvas. Canvases can also draw 3D content (using a technology called WebGL), but that is outside the scope of this course.
Part 2- Canvas Coordinates and Colors
Note: If you get confused where these next lines of code go in your files, please reference the Lab's Complete folder to see where code and what files are expected to be created.
3. Now that we have a reference to the drawing context, we can begin to draw some shapes and colors. Let’s put our drawing code in a separate file like we did with our number game. a. First, lets create a new Javascript file like last time (.js file extension) and name it “picture.js”. Create this file at the same level as your index.html file.
4. Second, add the script tag reference to load the file like we did before in your index.html, like so:

|
<script src="picture.js"></script> |
5. In the picture.js you just made, create a function called “drawPicture”. Inside this function we’ll be doing our drawing.

|
functiondrawPicture(){ } |
6. In your index.html file add a call to this function from your startup function so your picture will be displayed when the page is loaded. You can add a console statement inside your drawPicture function or use the debugger to test that the function is being called.
drawPicture();
|
drawPicture(); |
7. Let’s draw our first shape. In your picture.js, add the following line of code to your drawPicture function to display a rectangle:
 |
context.fillRect(100,300,200,50); |
8. If you refresh your page now, you might be disappointed that nothing showed up. But actually you did just draw your first shape. The problem is that you drew it in the default color of black, on top of a black background. Let’s fix this by changing the fill color of our shape before drawing the shape:
 |
context.fillStyle="white"; |
Now you should see a white rectangle appear on the screen.
9. As you can see the “fillRect” function draws a filled rectangle to the screen. But what do those four numbers mean? Glad you asked! They represent the position (x,y) of the upper left corner of the rectangle as well as the width and height of the rectangle in pixels
(the tiny digital dots of that make up your screen).
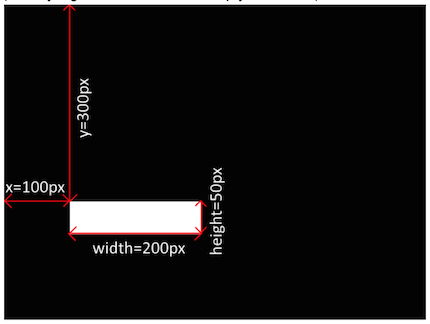 |
Part 3- Drawing Complex Shapes
10. You’re probably familiar with traditional graphs where the origin (0,0) is in the center or bottom left and x and y increase as you head up and to the right. This traditional coordinate system is called the Cartesian coordinate system.
The canvas’ coordinate space is slightly different: it has the origin (0,0) at the top left corner of the drawing context. The xcoordinate increases as you move to the right and decreases as you move to the left. The ycoordinate increases as you move downward and decreases as you move upward.
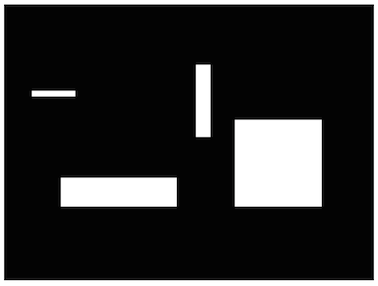
11. Try copying the fillRect line of code several times and modify the parameter values to draw a handful of rectangles to the screen at different locations of different sizes:

|
context.fillRect(100,300,200,50); context.fillRect(50,150,75,10); context.fillRect(333,105,25,125); context.fillRect(400,200,150,150); |
|
12. White rectangles are nice and all, but let’s see about adding some color to differentiate all our rectangles. We’ve already seen how to set the fill color to white. See what happens if you change the fill style to to “red” at the beginning and then change it to “green” in between drawing the second and third rectangle.
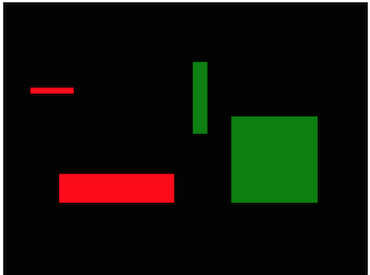 |
Notice how the last color you set the fill style to is used until you change it. We set the fill color to red then draw two rectangles (using that selected color). Then we change the fill color to green, and the two additional rectangles we draw use that color.
Part 4- Drawing Text
13. There are many different colors that you can use that have names:
 |
However, there are many more custom colors you can use. Computer colors are made up of three channels: red, green, and blue. Web graphics commonly support 24bit color, which means 8 bits (1 byte) per color channel (8 bits x 3 color channels = 24 bits). A byte (8 bits) can hold 256 possible values.
To specify a custom color use the following syntax (in quotes): "rgb(red,green,blue)" where “red”, “green”, and “blue” are numbers from 0 to 255. For example “rgb(127, 0, 255)” would yield a color that has a red component of half maximum brightness (127 of 255), a green component that is completely dark (0 of 255), and a blue component that is fully bright (255 of 255). Combining a medium red and a full blue value should yield a bluishpurple.
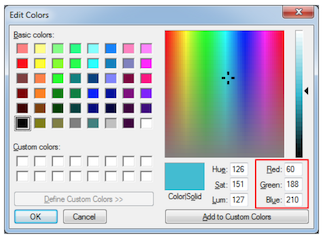
An alternative notation for colors is: "#RRGGBB" where RR, GG, and BB are a 2digit hexadecimal numbers ranging from 00 (decimal 0) to FF (decimal 255). Try making each rectangle a different custom color of your choice. Feel free to use an image editor of your choice to get colors you like and copy the RGB values into your code:
14. Now that you understand the fundamentals of coordinates and colors on a canvas, let’s try drawing something more complex than just rectangles. Let’s draw a custom path in the shape of a fish. Erase (or comment out) your rectangles, so we have a clear canvas to work with.
15. To start a define a path, start it using the command beginPath. Paths are drawn as lines or curves between sets of points. We want to move the virtual drawing pen to a starting location (without drawing a line), so use the command moveTo, specifying where we want to start (in this case at (400,150)).
context.beginPath();
|
context.beginPath(); context.moveTo(400,150); |
16. Now that the drawing pen is in our starting location, we can begin to define lines to be drawn. Add the following lines to form the shape of a fish. Each call to lineTo will move the drawing pen to a new location and define a line between its old and new positions.
context.lineTo(350,100);
|
context.lineTo(350,100); context.lineTo(200,100); context.lineTo(150,150); context.lineTo(100,100); context.lineTo(100,250); context.lineTo(150,200); context.lineTo(200,250); context.lineTo(350,250); context.lineTo(400,200); |
|
17. To close up the shape add one final line to return the pen to its starting position:
context.closePath();
|
context.closePath(); |
|
18. Now that we’ve defined a shape, we need to fill it. Set your fill style to blue and run the command to draw the path filled:
context.fillStyle="blue";
|
context.fillStyle="blue"; context.fill(); |
|
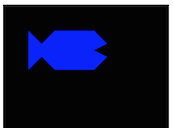
You should now see the shape of a fish:
 |
19. We can do more than just have filled shapes. We can also set the color and style of the shape’s outline, called it’s stroke. We’ve been using the “fillStyle” property to set the fill color. We can use another property, “strokeStyle”, to set the color of the shape’s outline. Like “fillStyle”, setting “strokeStyle” will apply its effect to all shapes drawn after it until it is changed to a different value.
Add a white border (5 pixels wide) around the fish:
context.strokeStyle="white";
|
context.strokeStyle="white"; context.lineWidth=5; context.stroke(); |
|
The stroke command works similar to the fill command, except that it draws an outline around the last path defined instead of filling it.
The default line width is 1 pixel wide, but setting “lineWidth” will change it to a different thickness. You can also adjust how lines appear when they meet at corners (“lineJoin”) or at the end of a line segment that does not close a complete shape (“lineCap”).
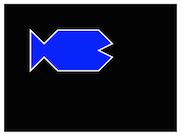
You should now have a blue fish with a white outline:
 |
Part 5- Drawing Multiple Fish
20. Our fish image is looking better, but it’s a little boxy. Let’s replace some of the line segments with curves. But before we get there, a brief math primer in case you’re not aware or have forgotten: Normally we measure angles in degrees, where there are 360° in a complete circle. Many computer math functions operate in a different angle unit called radians, where 360° = 2π radians (180° = π radians, 90° = 1⁄2π radians). Radians are based on the circumference along a circle of radius 1.
21. The arc function draws a circular arc, centered at a point, from one angle to another (in radians). It automatically draws a line from the last position to the starting point of the arc and the line continues from where the arc ends. Replace your path code with the following:
context.beginPath();
|
context.beginPath(); context.arc(350,150,50,0,1.5*Math.PI,true); context.arc(200,150,50,1.5*Math.PI,Math.PI,true); context.lineTo(100,100); context.lineTo(100,250); context.arc(200,200,50,Math.PI,Math.PI/2,true); context.arc(350,200,50,Math.PI/2,0,true); context.lineTo(350,175); context.closePath(); |
|
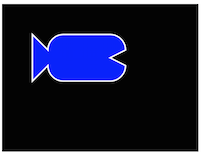
Your fish should look nice and rounded now:
 |
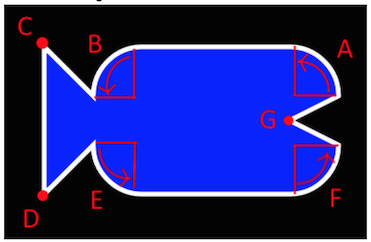
22. To make sure you understand how the arcs and lines work, look over the following annotated image with the code:
 |
-
context.arc(350,150,50,0,1.5*Math.PI,true);Draw an arc centered at (350,150) with radius 50 pixels. Start at 0 radians (facing right) and continue to 11⁄2π radians (up), in the counterclockwise direction (true is counterclockwise, false is clockwis) -
context.arc(200,150,50,1.5*Math.PI,Math.PI,true);Draw an arc centered at (200,150) with radius 50 pixels. Start at 11⁄2π radians (up) and continue until π radians (left), in the counterclockwise direction. A line is automatically connected from the end of the last arc to the beginning of this arc. -
context.lineTo(100,100);Starting where the last arc left off, draw a line to (100,100). -
context.lineTo(100,250);Starting where the last line left off, draw a line to (100,250). -
context.arc(200,200,50,Math.PI,Math.PI/2,true);Draw an arc centered at (200,200) with radius 50 pixels. Start at π radians (left) until 1⁄2π radians (down), in the counterclockwise direction. A line is automatically connected from the end of the last line to the beginning of this arc. -
context.arc(350,200,50,Math.PI/2,0,true);Draw an arc centered at (350,200) with radius 50 pixels. Start at 1⁄2π radians (down) until 0 radians (right), in the counterclockwise direction. A line is automatically connected from the end of the last arcto the beginning of this arc. -
context.lineTo(350,175);Starting where the last arc left off, draw a line to (350,175).
|
context.arc(350,150,50,0,1.5*Math.PI,true); context.arc(200,150,50,1.5*Math.PI,Math.PI,true); context.lineTo(100,100); context.lineTo(100,250); context.arc(200,200,50,Math.PI,Math.PI/2,true); context.arc(350,200,50,Math.PI/2,0,true); context.lineTo(350,175); |
|
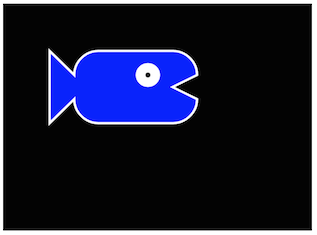
23. Arcs can also be used to make complete circles. Let’s add an eye to the fish. We’ll make it filled black with a large white stroke to look like an eye.
context.fillStyle="black";
|
context.fillStyle="black"; context.strokeStyle="white"; context.lineWidth=20; context.beginPath(); context.arc(300,150,15,0,Math.PI*2); context.fill(); context.stroke(); |
|
This time we drew an arc that went all the way from 0 to 2π radians (a complete circuit).
 |
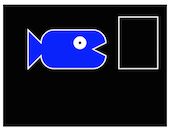
24. Our fish is looking pretty good. Now if only it could talk. Let’s add some text to the picture of the fish saying something. Begin by drawing a white rectangle as our speech bubble. This time we’ll not fill in the rectangle but only draw the stroke outline using strokeRect
(which is similar to fillRect, but it draws the outline using “strokeStyle”):
context.strokeStyle="white";
|
context.strokeStyle="white"; context.lineWidth=5; context.strokeRect(450,50,150,200); |
|
 |
Part 6- Scale and Rotate
25. To draw text, you can use fillText or strokeText to draw the text filled or only as an outline, using the colors you’ve defined with “fillStyle” and “strokeStyle”. Let’s add some text of the fish saying something:
context.fillStyle="white";
|
context.fillStyle="white"; context.fillText("Hello!",525,60); |
|
Note: to display multiple lines of text, you have to draw each line one at a time.
26. You should see the text “Hello!” displaying near the coordinates (525, 60), but it’s rather small. Let’s increase the font size to 40 pixels high and choose a different font (in this case “Impact”). Place the following before drawing the text:
context.font="40pxImpact";
|
context.font="40pxImpact"; |
|
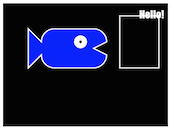 |
27. Oh, no! Our fish is speaking outside the box. By default the coordinates used for drawing text are the bottom leftcorner. We can change the vertical alignment to use the top of the text instead by adding:
context.textBaseline="top";
|
context.textBaseline="top"; |
|
28. The text is still leftjustified, but we can change that to be centered by adding the following line:
context.textAlign = "center";
|
context.textAlign = "center"; |
|
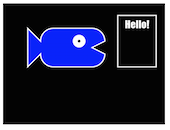 |
29. Now that we have a talking fish, he looks lonely. Let’s create another fish that will keep him company. Rename your “drawPicture” function to “drawFish” and create another function that named “drawPicture” that calls your fish function twice:
function drawPicture(){
|
function drawPicture(){ drawFish(); drawFish(); } |
|
30. You probably don’t see anything different. This is because the second fish is being drawn exactly the same on top of the first fish. One way to fix this would be to pass coordinate offset values to the “drawFish” function and add those coordinates to each of our canvas draw statements. Thankfully, there’s a simpler way.
You can use translation, scale, and rotation modifiers to the canvas context. Let’s experiment with this by drawing the first fish normally and translating the second to the left 75 pixels and down 200:
drawFish();
|
drawFish(); context.translate(-75,210); drawFish(); |
|
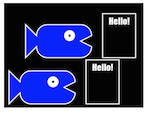
31. Add another translate call before the first fish to shift it up and to the left:
context.translate(-75,-25);
|
context.translate(-75,-25); |
|
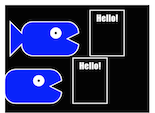
32. Unfortunately, this caused the second fish to be translated as well because the translate functions add to the current state. If only there was a way to save and revert back to a known good state... Oh wait, that’s what the save and restore functions are for!
context.save(); //save off the current state
|
context.save(); //save off the current state context.translate(-75,-25); drawFish(); context.restore(); //restore to the saved context state context.translate(-75,210); drawFish(); |
|
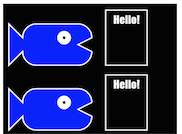
33. Looking better yet! But the fish look too similar. Let’s add some parameters to our “drawFish” function to choose the color, position, and speech. We’ll also move the context save/restore into the function:
function drawPicture(){
|
function drawPicture(){ drawFish("red","I'mafish",-75,-25); drawFish("blue","SoamI",-75,210); } function drawFish(fishColor,fishTalk,x,y){ context.save(); context.translate(x,y); context.beginPath(); context.closePath(); context.fillStyle=fishColor; context.fillText(fishTalk,525,60); context.restore(); } |
|
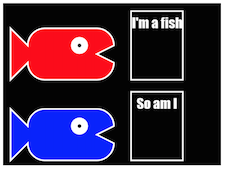
34. To avoid confusion, let’s adjust our x/y coordinates that we pass in to refer to absolute coordinates of where the fish should be displayed, rather than the offset of where we originally had drawn our first fish. The fish is centered around (250,200), so we’ll base our coordinates around that. So update your code to the following:
function drawPicture(){
|
function drawPicture(){ drawFish("red","I'm a fish",175,175); drawFish("blue","So am I",175,410); } function drawFish(fishColor,fishTalk,x,y){ context.save(); context.translate(x-250,y-200); context.beginPath(); } |
|
35. Let’s see about making the fish be different sizes and rotating them. Like translate, there’s also the ability to scale and rotate. Add a “scale” parameter to the function, and have the first fish use a scale of 0.5 (50%) and the second use a scale of 0.7 (70%):
function drawPicture(){
|
function drawPicture(){ drawFish("red","I'm a fish",175,175,0.5); drawFish("blue","So am I",175,410,0.7); } function drawFish(fishColor,fishTalk,x,y,scale){ } |
|
36. Add a scale statement before your translate statement to scale the fish by the specified amount. It takes two values: how much to scale is the x (horizontal) direction and in the y (vertical) direction:
context.scale(scale,scale);
|
context.scale(scale,scale); |
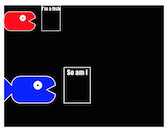
37. What happened to our positions? The issue here is that scale (and rotate) scale (rotate) around the origin (0,0), or more specifically our translated origin, not the center that we want to scale (rotate) around. If we want to scale around the center of the object, we need to translate the origin to the center of the object, scale around the new origin, and then translate it back.
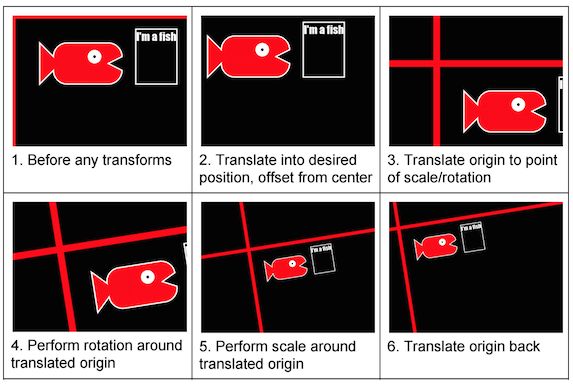
| In this case, the center of our picture (untranslated) is about at (250,200). So change the scale statement to: |
context.translate(250,200);
|
context.translate(250,200); context.scale(scale,scale); context.translate(-250,-200); |
38. Now to add rotation. Add an “angle” parameter to your function with the following values (in radians) to rotate the fish by a little bit in each direction:
drawFish("red","I'm a fish",175,175,0.5,-Math.PI*0.05);
|
drawFish("red","I'm a fish",175,175,0.5,-Math.PI*0.05); drawFish("blue","So am I",175,410,0.7,Math.PI*0.03); |
Then add the following line next to your “scale” statement:
context.rotate(angle);
|
context.rotate(angle); |
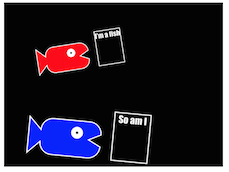
Part 7- Transparency
39. As one final effect, let’s add some illusion of depth that there are a lot of other fish swimming in the distance. We’ll first try this by drawing them semitransparent. Instead of using a standard “red” or “rgb(255,0,0)” color, we will use a color that is partly transparent. To do this use the following color syntax: "rgba(red, green, blue, alpha)" Red, green, and blue are your standard 0 to 255 values, but alpha is a decimal number from 0.0 (fully transparent) to 1.0 (fully opaque nontransparent).
Try drawing another fish in front of your first two with a 70% transparent (30% visible) green color:
drawFish("rgba(0,255,0,0.3)","Hi!",200,300,1.2,0);
|
drawFish("rgba(0,255,0,0.3)","Hi!",200,300,1.2,0); |
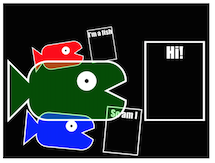
Notice how the color is mostly transparent and ends up tinting what is is in front of.
40. But what if we don’t want to just make the fill transparent, but also the lines? We could do a similar thing to “strokeStyle”, but there’s a simpler way. Try drawing the third fish a normal green but this time set “globalAlpha”:
context.globalAlpha=0.3;
|
context.globalAlpha=0.3; drawFish("green","Hi!",200,300,1.2,0); |
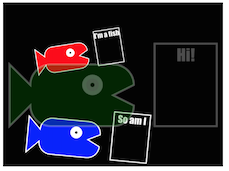
Notice how the fish now is fully transparent.
Part 8- Drawing Random Fish
41. Let’s wrap this up by adding a lot of fish in the background. But we don’t want them to all be chatterboxes, so let’s make the speech bubble not display if the text is blank:
if(fishTalk){
|
if(fishTalk){ context.strokeRect(450,50,150,200); context.fillText(fishTalk,525,60); } |
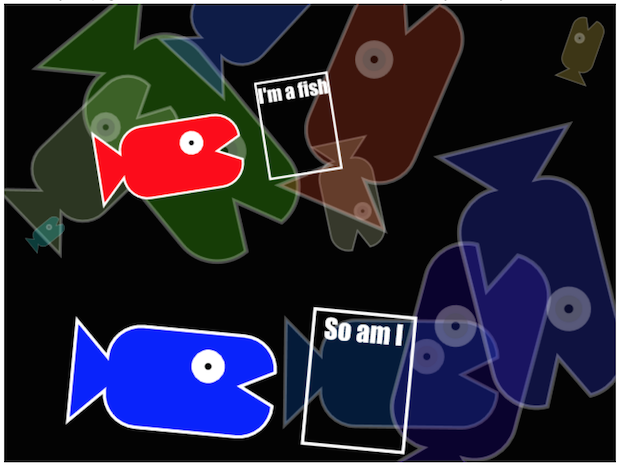
42. Now add a bunch of fish of random colors, positions, colors, and sizes:
function drawPicture(){
|
function drawPicture(){ context.globalAlpha=0.3; //make background fish transparent for(vari=0;i<10;i++){ drawFish( "rgb("+ //make randomized color below Math.floor(Math.random()*256)+"," + //R(0-255) Math.floor(Math.random()*256)+ "," + //G(0-255) Math.floor(Math.random()*256)+")", //B(0-255) null, //no speech Math.random()*appWidth,//randomx,0towidth Math.random()*appHeight, //randomy,0toheight Math.random(), //0%to100%scale (Math.random()-0.5)*Math.PI //-PI/2toPI/2rotation ); } context.globalAlpha=1; //reset transparency drawFish("red","I'm a fish",175,175,0.5,-Math.PI*0.05); drawFish("blue","So am I",175,410,0.7,Math.PI*0.03); } |
43. Refresh your page several times to see the randomness in effect in your fishy creation.
|